


Ready to Ware
 Alphachimp
"Even when you are sick, if you have something that doesn't look nice, you don't want to put it on." |


![]()
![]()
![]()
![]()
![]()
![]()
Sign up! Become a part of our community of friends.
 Alphachimp
"Even when you are sick, if you have something that doesn't look nice, you don't want to put it on." |
Alphachimp ![]() Part of the transparency section of Good Magazine, this short video commissioned by ED in '08 highlights details behind America's ranking in public education.
Part of the transparency section of Good Magazine, this short video commissioned by ED in '08 highlights details behind America's ranking in public education.
In 2002, UNICEF compared public education in 24 nations around the world. The U.S. ranked 18th. So what's the problem? Are we spending enough per student? Are students spending enough time in school? America needs to do some extra credit if its public education system is going to stay competitive. To boost America’s economy we must focus on strengthening K-12 education. Why? Economists estimate that if America raises student skills closer to that of European nations, the U.S. economy would grow by an additional 5% over 30 years resulting in an extra $1.5 trillion in 2037 alone—more than triple current U.S. spending on K-12 public education. |
Post a Comment Alphachimp Finding the right way view your data is as much an art as a science. The visualizations provided on Many Eyes range from the ordinary to the experimental. ManyEyes is deliberately providing a wide array of possibilities since this is an experimental site—and expect to see more soon. The podcast below traces the history of this data visualization project.
Both Viegas and Wattenberg are also known for their visualization-based artwork, which has been exhibited in venues such as the London Institute of Contemporary Arts and the Whitney Museum of American Art. The two became a team in 2003 when they decided to visualize Wikipedia, leading to the "history flow" project that revealed the self-healing nature of the online encyclopedia. They are currently exploring the power of web-based visualization and the social forms of data analysis it enables.
|
Alphachimp  This web 2.0 app drastically improves the (usually) tedious process of tracing family history, by combining the elegance of Flickr and the tools of social networking. http://www.geni.com

Alphachimp
|
Alphachimp 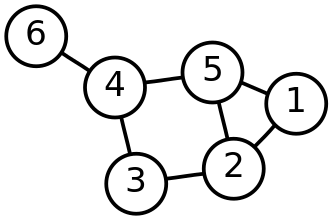 The power and flexibility of a network--whether a simple group of casual neighbors or a complex next generation communication network--depends not just on the number of connections, but on the quality of the nodes, and more important, the type of nodes. Below is a fantastic intro to the concept of graphs and networks. It helps in understanding the a social graph and how it differs from a social network.
|
Alphachimp 
The implications for communities, networks, social enterprise and individuals is huge--access to one of the largest social networking platform in the world. It will be intriguing to see how Google's Open Social grows as a contender.
When Facebook first opened up its API in Fall of 2007, Worldchanging contributor, Jon Lebkowsky, observed that Google's collaboration with social network platforms to create Open Social:
Google's insight was that you could create a standard API that many social sites could adopt, so that developers could build applications to work across platforms. This would presumably stimulate innovations and make them more broadly available – great for users and second tier social networking sites, less great for Facebook (though in my opinion, anything that boosts social networking is good for anyone in that business).Henry Blodget of Silicon Alley Insider sees the recent decision as another brilliant Facebook move but predicts that Facebook wants to resist going completely "open" and allowing members to export their information and relationships at will.
Facebook might lose its control over its core asset (the billions of relationships among its millions of members, a.k.a., the social graph). This move seems another smart step toward a hybrid strategy: Allow app makers (and Facebook) to extend social-graph functionality to the web, gather more app users, and recruit more members--but retain full control over the social graph itself.
Alphachimp
|
Post a Comment Alphachimp
Scaredy-cat clients. Clients -- from brand managers to CMOs -- are the most risk-averse animals the world has ever seen Cunning Old Media. The old folks -- TV, radio, print -- already have all their metrics in place. Geek-o-phobia. Agencies have done a lousy job of integrating digital people into creative departments. Finance Department Fascists. Because we have a research industry that can't measure or predict emotional involvement, we just fall back on conventional measures of ROI We need a metric that captures the many nuances of involvement a consumer has for a brand. Nothing warms the cockles of a CFO's heart like an expanding pie chart, or a trend arrow pointing at the heavens. Until we get that, we're stuck trying to quantify thing like "passion" and "love." |
Alphachimp  As designers and facilitators of rich conversations, we serve a valuable role in innovation.
As designers, we can give shape to the results of those conversations. We produce a thing--sometimes called a "work product" or "knowledge object" or "communication tool" or [insert corporatespeak term here].
These work products can take the form of a static model, a complex information graphic, a magazine article, a schematic diagram, a fully interactive website, a private wiki, an unedited blog post, or an airport lobby-sized installation art piece. The form is chosen for the target audience (and.. ah yes, the budget) in question.
Whatever the output, the real heart and soul of the innovation process seems to remain the conversation.
The network members of Social Media Today are playing in the emerging space of new ways to have those conversations.
In economics, business and government policy,- something new - must be substantially different, not an insignificant change. In economics the change must increase value, customer value, or producer value. The term innovation may refer to both radical and incremental changes to products, processes or services. |


